绘图和图形#
注意
当此处提到术语“绘图”或“图形”时,我们指的是“矢量图形”或“线条艺术”。
因此,请将这些术语视为同义词!
PDF 文件支持基本的绘图操作作为其语法的一部分。这些是 矢量图形,包括基本的几何对象,如线条、曲线、圆形、矩形,以及指定颜色。
此类操作的语法在 Adobe PDF 参考 的第 643 页“A Operator Summary”中定义。为 PDF 页面指定这些运算符发生在其 contents 对象中。
PyMuPDF 通过其 Shape 类实现了大部分可用功能,这与其他包(例如 reportlab)中的“画布”概念类似。
Shape 总是作为页面的子对象创建,通常使用诸如 shape = page.new_shape() 的指令。该类定义了许多在页面区域上执行绘图操作的方法。例如,last_point = shape.draw_rect(rect) 沿着适当定义的 rect = pymupdf.Rect(...) 的边界绘制一个矩形。
返回的 last_point 始终 是绘图操作结束的 Point(“最后点”)。每个这样的基本绘图都需要后续调用 Shape.finish() 来“结束”它,但可能有多个绘图共用一个 finish() 方法。
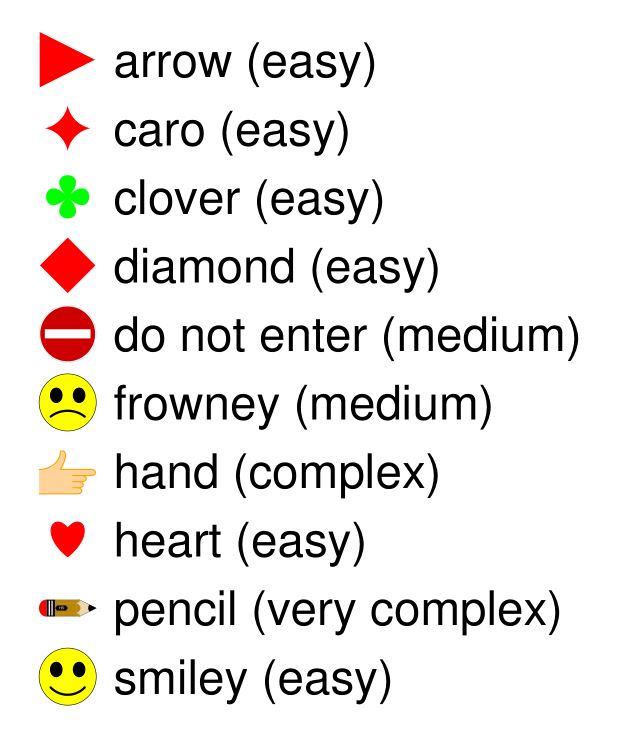
实际上,Shape.finish() 定义了一组之前的绘图操作,以形成一个——可能相当复杂的——图形对象。PyMuPDF 在 shapes_and_symbols.py 中提供了几个预定义的图形,演示了其工作原理。
如果您导入此脚本,您还可以直接使用其图形,如下例所示
# -*- coding: utf-8 -*-
"""
Created on Sun Dec  9 08:34:06 2018

@author: Jorj
@license: GNU AFFERO GPL V3

Create a list of available symbols defined in shapes_and_symbols.py

This also demonstrates an example usage: how these symbols could be used
as bullet-point symbols in some text.

"""

import pymupdf
import shapes_and_symbols as sas

# list of available symbol functions and their descriptions
tlist = [
         (sas.arrow, "arrow (easy)"),
         (sas.caro, "caro (easy)"),
         (sas.clover, "clover (easy)"),
         (sas.diamond, "diamond (easy)"),
         (sas.dontenter, "do not enter (medium)"),
         (sas.frowney, "frowney (medium)"),
         (sas.hand, "hand (complex)"),
         (sas.heart, "heart (easy)"),
         (sas.pencil, "pencil (very complex)"),
         (sas.smiley, "smiley (easy)"),
         ]

r = pymupdf.Rect(50, 50, 100, 100)  # first rect to contain a symbol
d = pymupdf.Rect(0, r.height + 10, 0, r.height + 10)  # displacement to next rect
p = (15, -r.height * 0.2)  # starting point of explanation text
rlist = [r]  # rectangle list

for i in range(1, len(tlist)):  # fill in all the rectangles
    rlist.append(rlist[i-1] + d)

doc = pymupdf.open()  # create empty PDF
page = doc.new_page()  # create an empty page
shape = page.new_shape()  # start a Shape (canvas)

for i, r in enumerate(rlist):
    tlist[i][0](shape, rlist[i])  # execute symbol creation
    shape.insert_text(rlist[i].br + p,  # insert description text
                   tlist[i][1], fontsize=r.height/1.2)

# store everything to the page's /Contents object
shape.commit()

import os
scriptdir = os.path.dirname(__file__)
doc.save(os.path.join(scriptdir, "symbol-list.pdf"))  # save the PDF
这是脚本的输出结果
如何提取绘图#
v1.18.0 新增
页面发出的绘图命令(矢量图形)可以作为字典列表提取。有趣的是,这适用于 所有支持的文档类型,而不仅仅是 PDF:所以您也可以将其用于 XPS、EPUB 等格式。
页面方法 Page.get_drawings() 访问绘图命令并将其转换为 Python 字典列表。每个字典(称为“路径”)代表一个独立的绘图——它可以像一条简单的直线,也可以是代表前一节中某个形状的线条和曲线的复杂组合。
path 字典的设计使得它可以很容易地被 Shape 类及其方法使用。这里有一个页面包含一个路径的示例,该路径在矩形 Rect(100, 100, 200, 200) 内部绘制一个带红色边框的黄色圆形
>>> pprint(page.get_drawings())
[{'closePath': True,
'color': [1.0, 0.0, 0.0],
'dashes': '[] 0',
'even_odd': False,
'fill': [1.0, 1.0, 0.0],
'items': [('c',
            Point(100.0, 150.0),
            Point(100.0, 177.614013671875),
            Point(122.38600158691406, 200.0),
            Point(150.0, 200.0)),
            ('c',
            Point(150.0, 200.0),
            Point(177.61399841308594, 200.0),
            Point(200.0, 177.614013671875),
            Point(200.0, 150.0)),
            ('c',
            Point(200.0, 150.0),
            Point(200.0, 122.385986328125),
            Point(177.61399841308594, 100.0),
            Point(150.0, 100.0)),
            ('c',
            Point(150.0, 100.0),
            Point(122.38600158691406, 100.0),
            Point(100.0, 122.385986328125),
            Point(100.0, 150.0))],
'lineCap': (0, 0, 0),
'lineJoin': 0,
'opacity': 1.0,
'rect': Rect(100.0, 100.0, 200.0, 200.0),
'width': 1.0}]
>>>
注意
您(至少)需要 4 条(三阶)贝塞尔曲线才能以可接受的精度绘制一个圆形。请参阅这篇 维基百科文章 获取一些背景信息。
以下代码片段提取页面的绘图并在新页面上重新绘制它们
import pymupdf
doc = pymupdf.open("some.file")
page = doc[0]
paths = page.get_drawings()  # extract existing drawings
# this is a list of "paths", which can directly be drawn again using Shape
# -------------------------------------------------------------------------
#
# define some output page with the same dimensions
outpdf = pymupdf.open()
outpage = outpdf.new_page(width=page.rect.width, height=page.rect.height)
shape = outpage.new_shape()  # make a drawing canvas for the output page
# --------------------------------------
# loop through the paths and draw them
# --------------------------------------
for path in paths:
    # ------------------------------------
    # draw each entry of the 'items' list
    # ------------------------------------
    for item in path["items"]:  # these are the draw commands
        if item[0] == "l":  # line
            shape.draw_line(item[1], item[2])
        elif item[0] == "re":  # rectangle
            shape.draw_rect(item[1])
        elif item[0] == "qu":  # quad
            shape.draw_quad(item[1])
        elif item[0] == "c":  # curve
            shape.draw_bezier(item[1], item[2], item[3], item[4])
        else:
            raise ValueError("unhandled drawing", item)
    # ------------------------------------------------------
    # all items are drawn, now apply the common properties
    # to finish the path
    # ------------------------------------------------------
    shape.finish(
        fill=path["fill"],  # fill color
        color=path["color"],  # line color
        dashes=path["dashes"],  # line dashing
        even_odd=path.get("even_odd", True),  # control color of overlaps
        closePath=path["closePath"],  # whether to connect last and first point
        lineJoin=path["lineJoin"],  # how line joins should look like
        lineCap=max(path["lineCap"]),  # how line ends should look like
        width=path["width"],  # line width
        stroke_opacity=path.get("stroke_opacity", 1),  # same value for both
        fill_opacity=path.get("fill_opacity", 1),  # opacity parameters
        )
# all paths processed - commit the shape to its page
shape.commit()
outpdf.save("drawings-page-0.pdf")
可以看出,它与 Shape 类具有高度的一致性。但有一个例外:出于技术原因,这里的 lineCap 是一个包含 3 个数字的元组,而在 Shape(以及 PDF 中)它是一个整数。因此,我们只需取该元组的最大值。
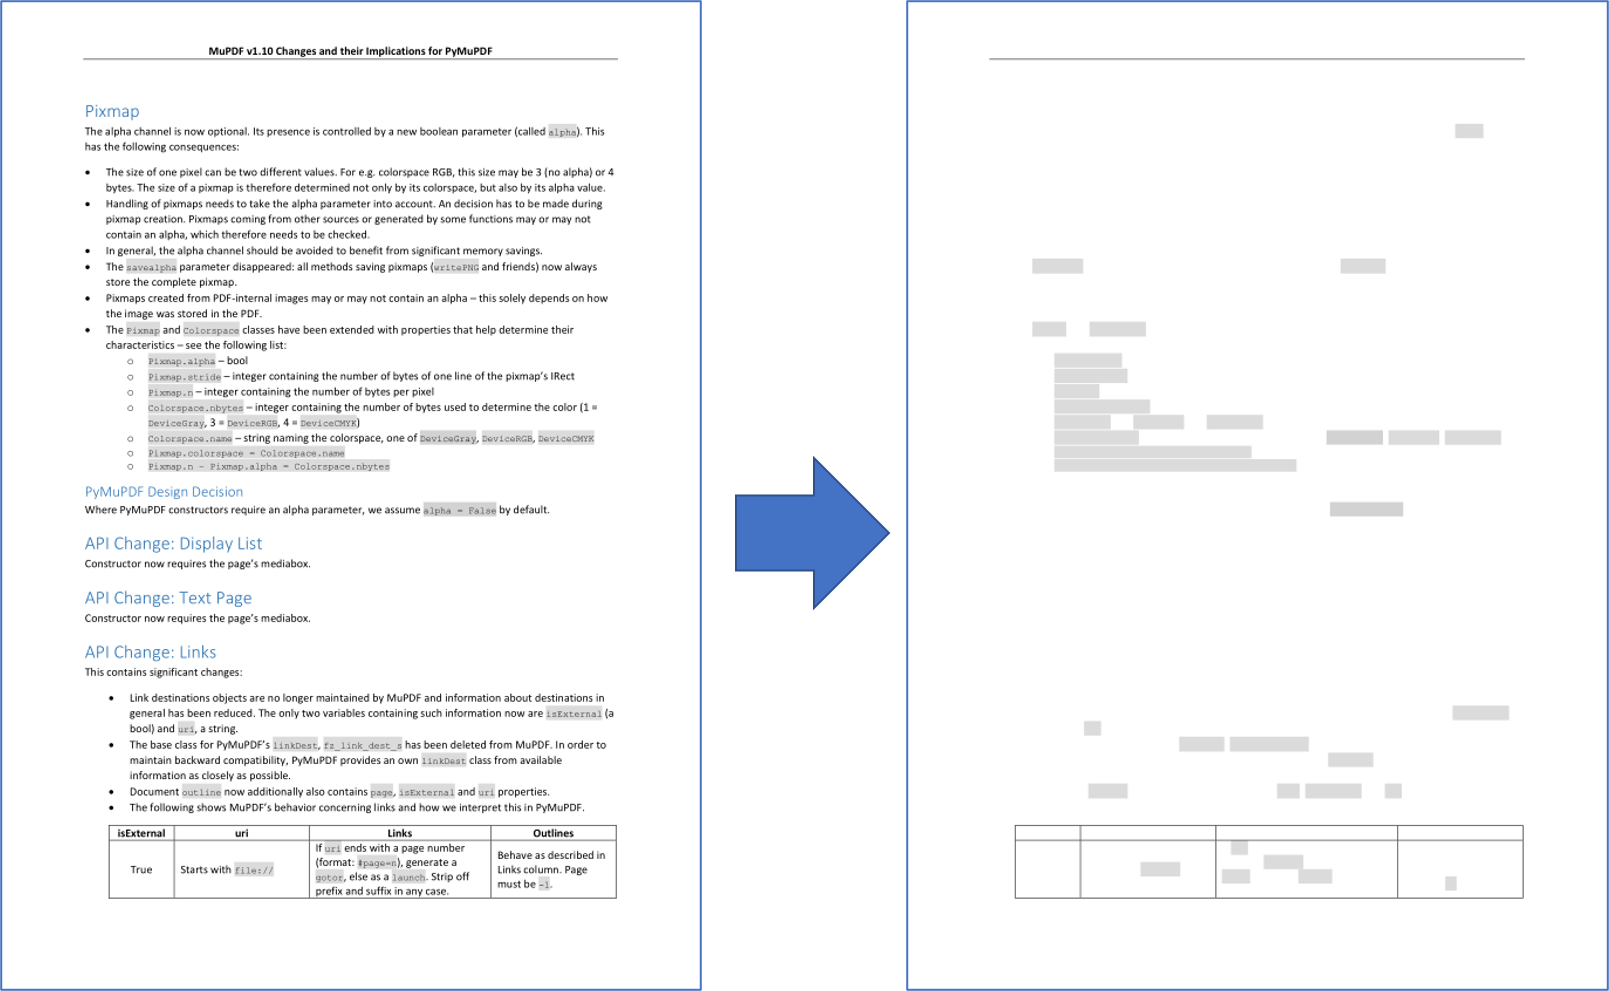
以下是上一脚本创建的示例页面的输入和输出对比
注意
图形的重构(如此处所示)并不完美。在此版本中,以下方面不会被重现
页面定义可能很复杂,包含用于不显示/隐藏某些区域以使其不可见的指令。诸如此类的内容会被
Page.get_drawings()忽略——它将始终返回所有路径。
注意
您可以使用路径列表创建自己的列表,例如页面上的所有线条或所有矩形,并根据颜色、页面位置等标准进行子选择。
如何删除绘图#
要删除绘图/矢量图形,我们必须使用绘图的边界框创建一个 涂黑注释,然后添加并应用涂黑操作来删除它。
以下代码展示了删除页面上找到的第一个绘图的示例
paths = page.get_drawings()
rect = paths[0]["rect"]  # rectangle of the 1st drawing
page.add_redact_annot(rect)
page.apply_redactions(0,2,1)  # potentially set options for any of images, drawings, text
注意
请参阅 Page.apply_redactions() 了解可发送的参数选项 - 您可以将删除选项应用于受注释区域约束的图像、绘图和文本对象。
如何绘制图形#
绘制图形就像调用您可能想要的 绘图方法 类型一样简单。您可以直接在页面上或在 Shape 对象中绘制图形。
例如,绘制一个圆形
# Draw a circle on the page using the Page method
page.draw_circle((center_x, center_y), radius, color=(1, 0, 0), width=2)

# Draw a circle on the page using a Shape object
shape = page.new_shape()
shape.draw_circle((center_x, center_y), radius)
shape.finish(color=(1, 0, 0), width=2)
shape.commit(overlay=True)
Shape 对象可用于组合多个绘图,这些绘图应接收由 Shape.finish() 指定的共同属性。